
Continuous Monitoring
Overview of section contents:
Section |
Description |
|---|---|
Kubernetes Monitoring |
Automated process to observe and detect compliance issues and security threats, especially with Kubernetes |
Monitoring an application’s state is one of the most effective ways to anticipate problems and discover bottlenecks in a production environment. Yet it is also one of the biggest challenges.
The growing adoption of microservices makes logging and monitoring a very complex problem since a large number of applications, distributed and diversified in nature, are communicating, and a single point of failure can stop the entire process.
Continuous Monitoring (CM) is an automated process to observe and detect compliance issues _and _security threats; it helps to monitor, detect, and study metrics, and to resolve issues in real-time.
CM means monitoring:
Infrastructure that includes data centers, networks, hardware, software, servers, storage, etc. Common metrics to watch are: server availability; CPU; servers; system uptime; database health; disk usage; storage; security etc.
Applications that track software performance. Common measures to track are availability; error rate; throughput; response time; end-user transactions; Service Level Agreement (SLA) etc.
Network or network activity and related hardware (firewalls, routers, switches, servers, etc). It measures latency; multiple port metrics; server bandwidth; packets flow, etc.
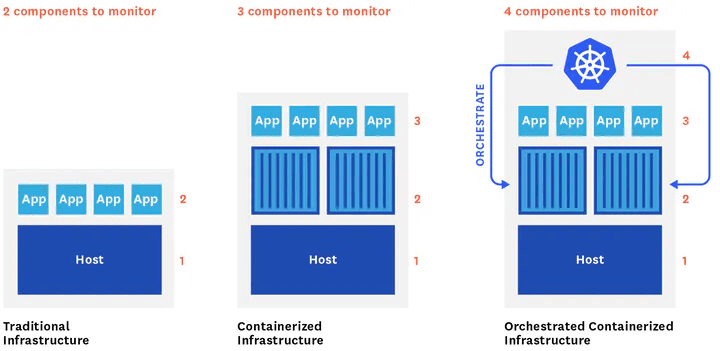
Kubernetes monitoring
Kubernetes runs in more than 70 percent of container environments (see Kubernetes adoption, security, and market trends report 2021 ). And monitoring has become a key way to extract runtime information. which is critical when troubleshooting issues and optimizing performance, both proactively and reactively.
However, Kubernetes presents a unique challenge on two fronts: setup and monitoring. It’s difficult to nail the deployment in an organized and_ high-performing_ way. Common mistakes involve incorrectly sizing of nodes, consolidating containers, or properly creating namespaces.
Roughly 49 percent of containers use under 30% of their requested CPU allocation, and 45% of containers use less than 30% of the RAM (see See 10 Trends in Real-World Container Use ). Real-time monitoring can help in preventing these problems.
Kubernetes monitoring captures logs and events from the cluster, pods, containers, host machines, and containerized applications.
Three types of Kubernetes metrics can be tracked:
Resource metrics that include information like CPU, memory usage, filesystem space, network traffic, etc. that can be queried using the Kubernetes Metrics API.
Service metrics include metrics produced by Kubernetes infrastructure, as well as those produced by containerized applications by deploying the Kube-state-metrics component.
Custom metrics implemented using additional adapters to add metrics through the Kubernetes API aggregation.
In addition to monitoring, engineers may also want to capture logs _and _events. The simplest way for logging is to write logs to standard output (stdout) and standard error (stderr) streams. As these logs are created, the kubelet agent writes them into a separate file that can be accessed by the user. This process is known as node-level logging.
A significant problem with node-level logging is the instability of logs: when a Kubernetes pod terminates or moves, logs are deleted and this makes it impossible to review them after a crash.
To get around this issue, NSDF will need to set up cluster-level logging not natively supported by Kubernetes since it relies on additional drivers to push logs to the storage back-end.
There are two approaches to set up the _cluster-level logging _service:
use Cloud Native Computing Foundation (CNCF) projects. This approach has the advantage of using open-source projects and being backed up by large and active communities.
use of Software as a Service (SaaS) software, usually provided by commercial companies as a_ pay-per-use _service.
Container Advisor, Prometheus, Grafana
This CNCF monitoring solution is made of a:
Container Advisor is a monitoring tool that exposes data from running containers, including resource usage and performance metrics.
Prometheus provides event monitoring and alerting capabilities, including data stored in the form of metrics, time-series data collection, alerts, monitoring, and querying. Prometheus has emerged in the last years as the d_e-facto open-source standard_ for Kubernetes.
Grafana is a web application for analytics and interactive visualization. It includes charts, graphs, and alerts. There are also many ready-to-use dashboards in Grafana Labs; (e.g. a dashboard to control AWS costs; a dashboard to check the healthiness of an nginx load-balancer, etc).

Example of Grafana dashboard
ElasticSearch, Logstash, Kibana
Another solution is to use the “ElasticSearch + Logstash + Kibana“ (ELK) stack that is composed by:
Elasticsearch is _a distributed, open-source search and analysis engine with full-text indexing capabilities, based on Apache Lucene, Data can be parsed, normalized, and enriched before being indexed.
Logstash is a data collection engine that acts as a data pipeline. Users can aggregate logs and event data from a variety of potential sources and enrich the data with out-of-the-box aggregation and mutations.
Kibana is a data visualization tool to create histograms, charts, graphs, and other real-time visual representations.
When Fluentd\ is used instead of _Logstash, _then _the stack is renamed EFK.
ELK/EFK may have some problems with increasingly log volumes.

Example of Kibana dashboard
Other K8s monitoring/Logging solutions
Some other solutions, that may be worth NSDF considerations, are:
Sematext Monitoring is a Software as a Service (SaaS) monitoring solution for both traditional and microservice-based applications, capturing metrics and events in real-time.
Sensu is a SaaS solution that is free for <100 nodes. It offers an end-to-end observability pipeline to collect, filter, and transform monitoring events and send them to a database. The metrics can include system metrics, as well as custom application metrics.
Logz.io is a SaaS solution that is free for the community with 1 day of log retention (max 1GiB). It’s a fully managed and autoscaling ELK stack and has some ML analytics.
Jaeger is a free tracing tool used for monitoring and troubleshooting in complex distributed systems. It was released and open-sourced by Uber Technologies in 2016. With Jaeger, users can perform root cause analysis, distributed transaction monitoring, distributed context propagations, service dependency analysis, and performance and latency optimization.
Kubewatch is a watcher that publishes notifications to available collaboration hubs/notification channels. Once the Kubewatch pod is running, events will start streaming to a Slack channel or other configured webhooks.
Weave Scope is a monitoring tool that allows gaining operational insights and it allows to manage containers and run diagnostic commands within this UI.Very strong candidate
Fluent Bit is a lightweight data shipper that excels in acting as an agent on edge-hosts, collecting and pushing data down the pipelines.
Kubernetes Dashboard is a basic simple-to-setup web add-on for K8s clusters. It exposes basic metrics across all nodes and monitors the health of workloads (pods, deployments, replica sets, cron jobs, etc.).
Lens is not a full monitoring solution, but rather a Kubernetes integrated development environment (IDE). The service bundles a contextual terminal with Prometheus statistics while ensuring that logs are easily viewable. Also, real-time graphs are available in the dashboard.
Note that NSDF excluded from the list any professional, production-grade but expensive tools such as Datadog, New Relic, Dynatrace, Instana, Turbonomic, Sysdig, Splunk, etc.
Links/Bibliography
List: